
Bitcoin price recovered from the $62,700 area as buyers defended a key support zone, but ETF outflows, weak trend signals, and heavy overhead liquidity continue to limit the rebound.
Summary
- Bitcoin price rose 1.2% to about $63,650 after finding buyers near $62,700.
- The 4-hour RSI climbed to 58.76, showing an improvement in short-term momentum.
- Nearly $390 million left US spot Bitcoin ETFs during the previous trading week.
- Liquidity clusters near $64,100 and $64,800 could shape Bitcoin’s next move.
Bitcoin price action today
According to data from crypto.news, Bitcoin (BTC) price traded near $63,650 on Aug. 17, up about 1.2% on the day after recovering from an intraday low of $62,751.
The move followed several unsuccessful attempts by sellers to push BTC below the $62,500–$62,700 region. Bitcoin had fallen from above $65,000 earlier in August, leaving the market vulnerable to a deeper correction before buyers returned near monthly support.
BTC reached an intraday high of $63,717 during the recovery. The bounce also moved the price above the $63,166 level, which marks the 78.6% Fibonacci retracement of the advance from $57,803 to $82,864.
Holding above that retracement level keeps Bitcoin inside the range formed after its June sell-off. However, the daily chart shows that BTC has not yet reversed the wider decline from its May peak.
The recovery coincided with modest gains in US equity futures. Nasdaq 100 futures rose as technology shares led a broader risk-asset rebound, while lower expectations for another aggressive Federal Reserve rate increase supported demand for Bitcoin.
The dollar fell to a 10-day low as Treasury yields eased. A weaker dollar can support assets priced in dollars, although elevated bond yields remain a source of competition for capital.
What is driving Bitcoin’s rebound?
Bitcoin’s immediate recovery came from buying pressure around $62,500 rather than a clear improvement in institutional demand. The level has acted as support several times since late July, encouraging short-term traders to buy after the latest decline.
The 4-hour chart shows that momentum improved as BTC moved back toward $63,700. The relative strength index rose to 58.76 from near 40, while its signal average remained lower at 43.57.
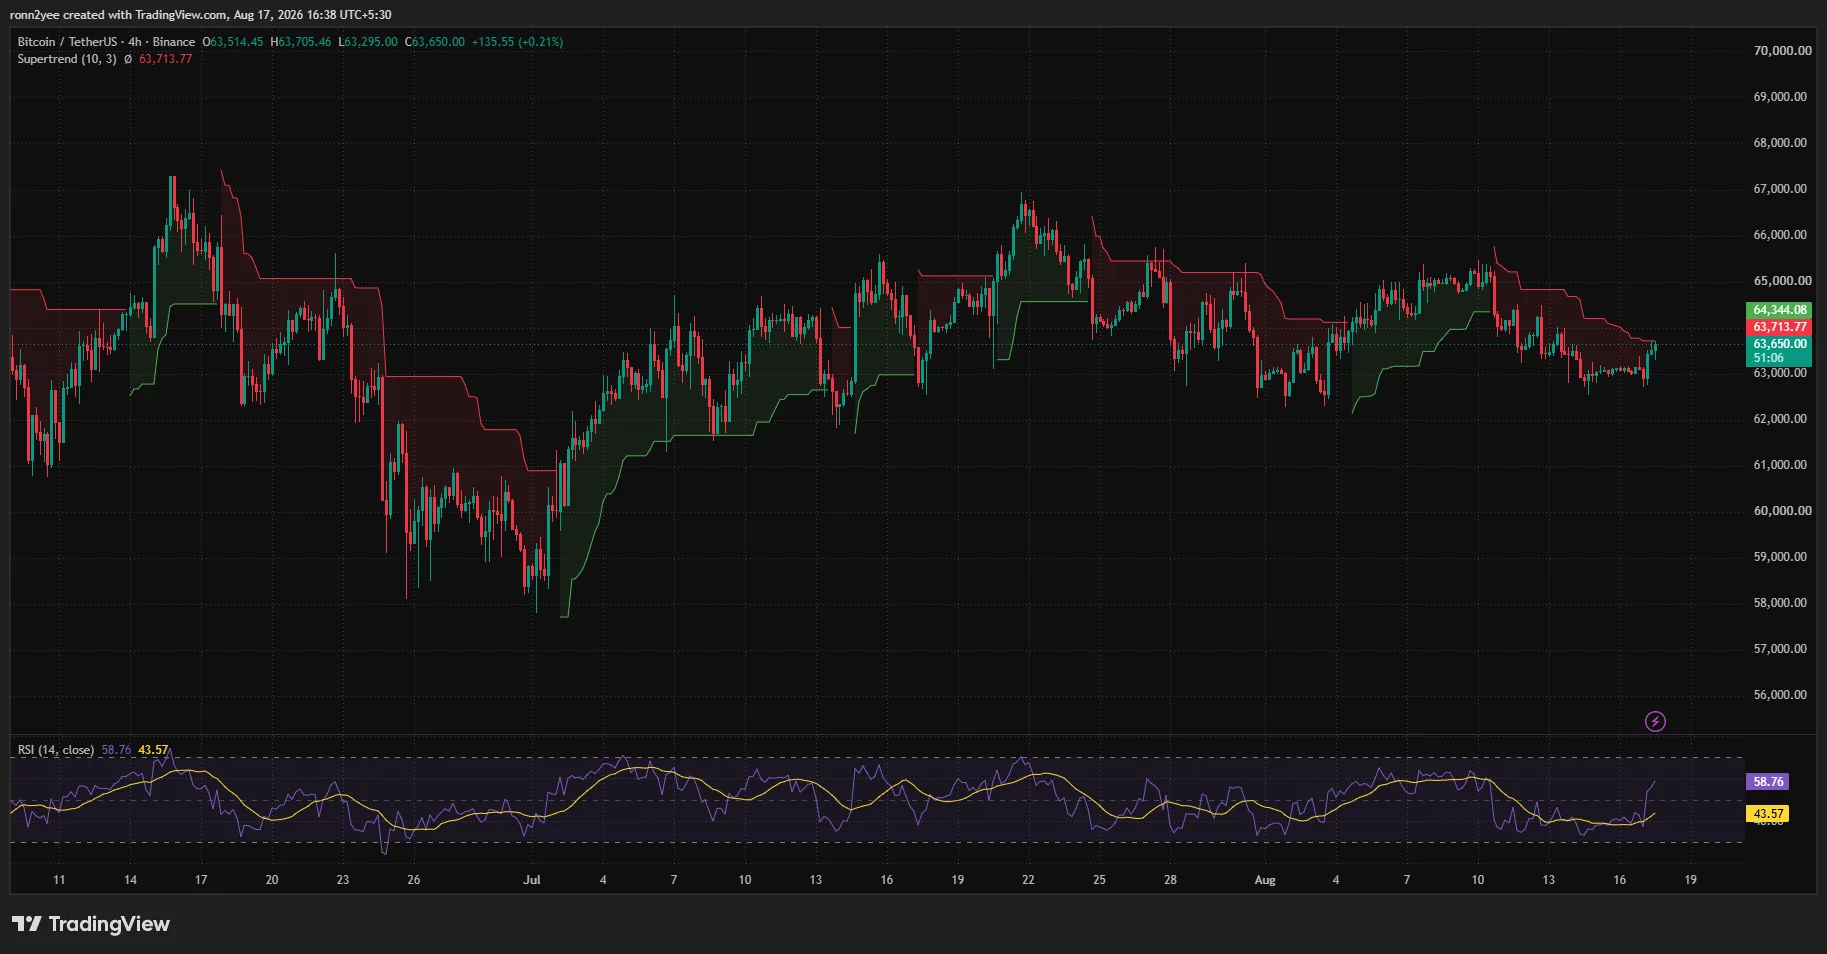
An RSI reading above 50 indicates that short-term buying momentum has overtaken selling momentum. Bitcoin still needs to hold the recovery through several 4-hour closes because previous rebounds in August stalled between $64,500 and $65,500.
The Supertrend indicator also shows that the reversal remains incomplete. BTC was trading slightly below the indicator’s resistance line near $63,714 at the time of the chart, while another important level stood near $64,344.
A sustained move above both levels would give buyers more control and place the early-August highs back in view. Rejection near the same area would leave Bitcoin exposed to another test of $63,000.
US ETF outflows keep Bitcoin bulls cautious
The rebound has developed despite continued withdrawals from US spot Bitcoin exchange-traded funds. According to SoSoValue data, the products recorded $389.71 million in combined net outflows between Aug. 10 and Aug. 14.
Investors withdrew $144.67 million on Monday, followed by further outflows of $61.16 million on Wednesday, $131.13 million on Thursday, and $57.63 million on Friday.
The weekly withdrawals followed the funds’ strongest inflow week since April, suggesting that US institutional demand has not yet established a steady recovery. Continued redemptions could make it harder for Bitcoin to sustain a move above $65,000.
US regulatory expectations have also weakened. Polymarket traders assigned the CLARITY Act a roughly 20% chance of becoming law in 2026 on Aug. 17, down from above 80% earlier in the year.
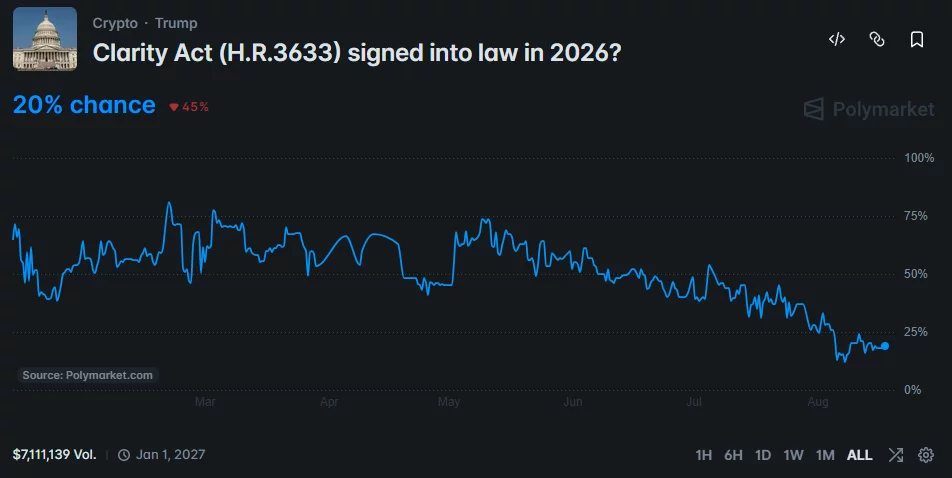
The decline followed the Senate’s failure to advance the crypto market structure legislation before its recess. Lower passage odds do not directly determine Bitcoin’s price, but they reflect fading expectations that US lawmakers will provide clear rules for crypto markets this year.
Bitcoin liquidation map points to $64,000 battle
CoinGlass’s one-week liquidation heatmap shows large concentrations of leveraged positions above Bitcoin’s current price.
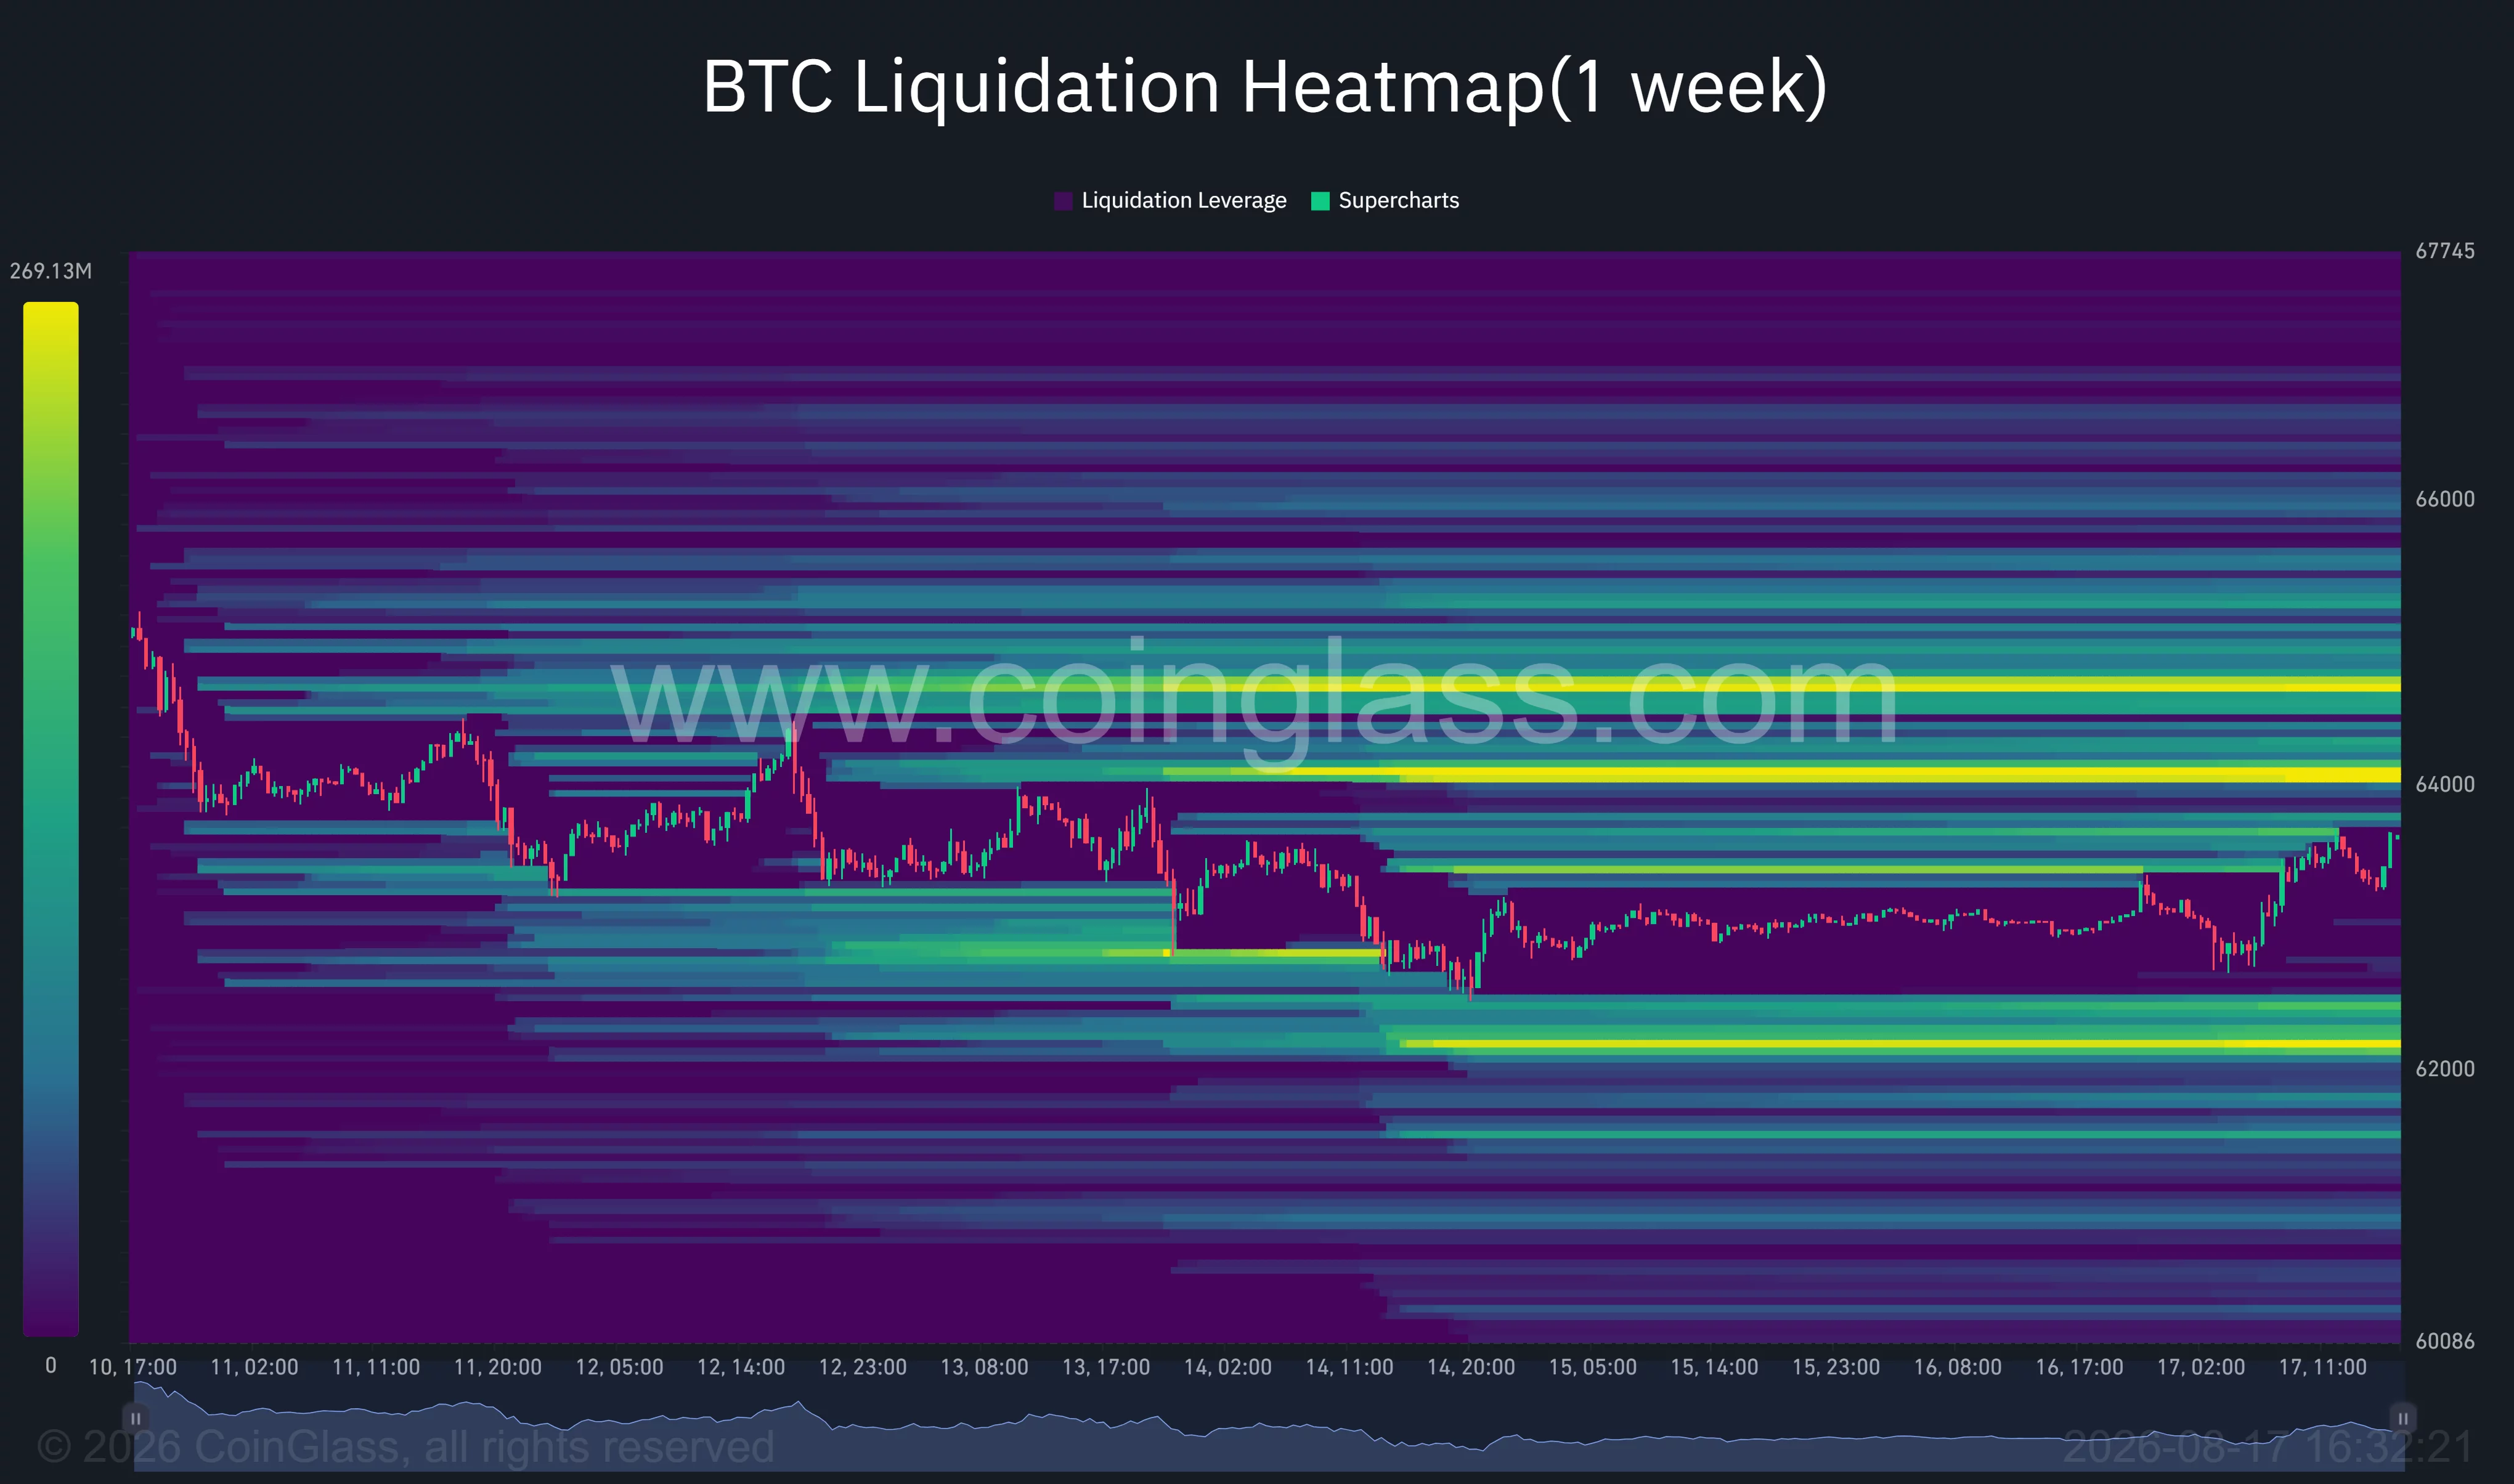
The nearest major liquidity band sits around $64,000–$64,200. A brighter and larger cluster appears between approximately $64,700 and $64,900, while additional positions are concentrated above $65,000.
Price often moves toward areas with heavy liquidity because those levels contain stop orders and liquidation points. If Bitcoin clears $64,200, forced closures of short positions could accelerate the move toward $64,800 and then $65,500.
The heatmap also shows a large downside cluster near $62,200–$62,300. Failure to hold $62,700 could therefore pull the market toward that liquidity before buyers get another opportunity to defend the broader range.
Lower liquidity also appears around $61,500, with the daily swing low near $57,800 remaining the larger bearish reference point.
The wide separation between major liquidation zones means BTC could experience sharp price swings even if the overall daily range remains unchanged.
Bitcoin must reclaim $65,500 to change the trend
Analyst Ted Pillows said Bitcoin had held above $62,000 but needed to break $65,500 to develop stronger bullish momentum.
“Bitcoin held above the $62,000 level and is now bouncing back,” Pillows wrote on X.
He identified $61,900 as the main downside threshold and said a loss of that level could expose the $59,000–$60,000 region.
The daily chart supports a cautious outlook. The Aroon Down reading stood at 42.86%, while Aroon Up was at 0%, showing that the market had not recently established a meaningful new high. Bear Bull Power also remained negative at -834.98, indicating that sellers retained an advantage on the wider timeframe despite the daily gain.
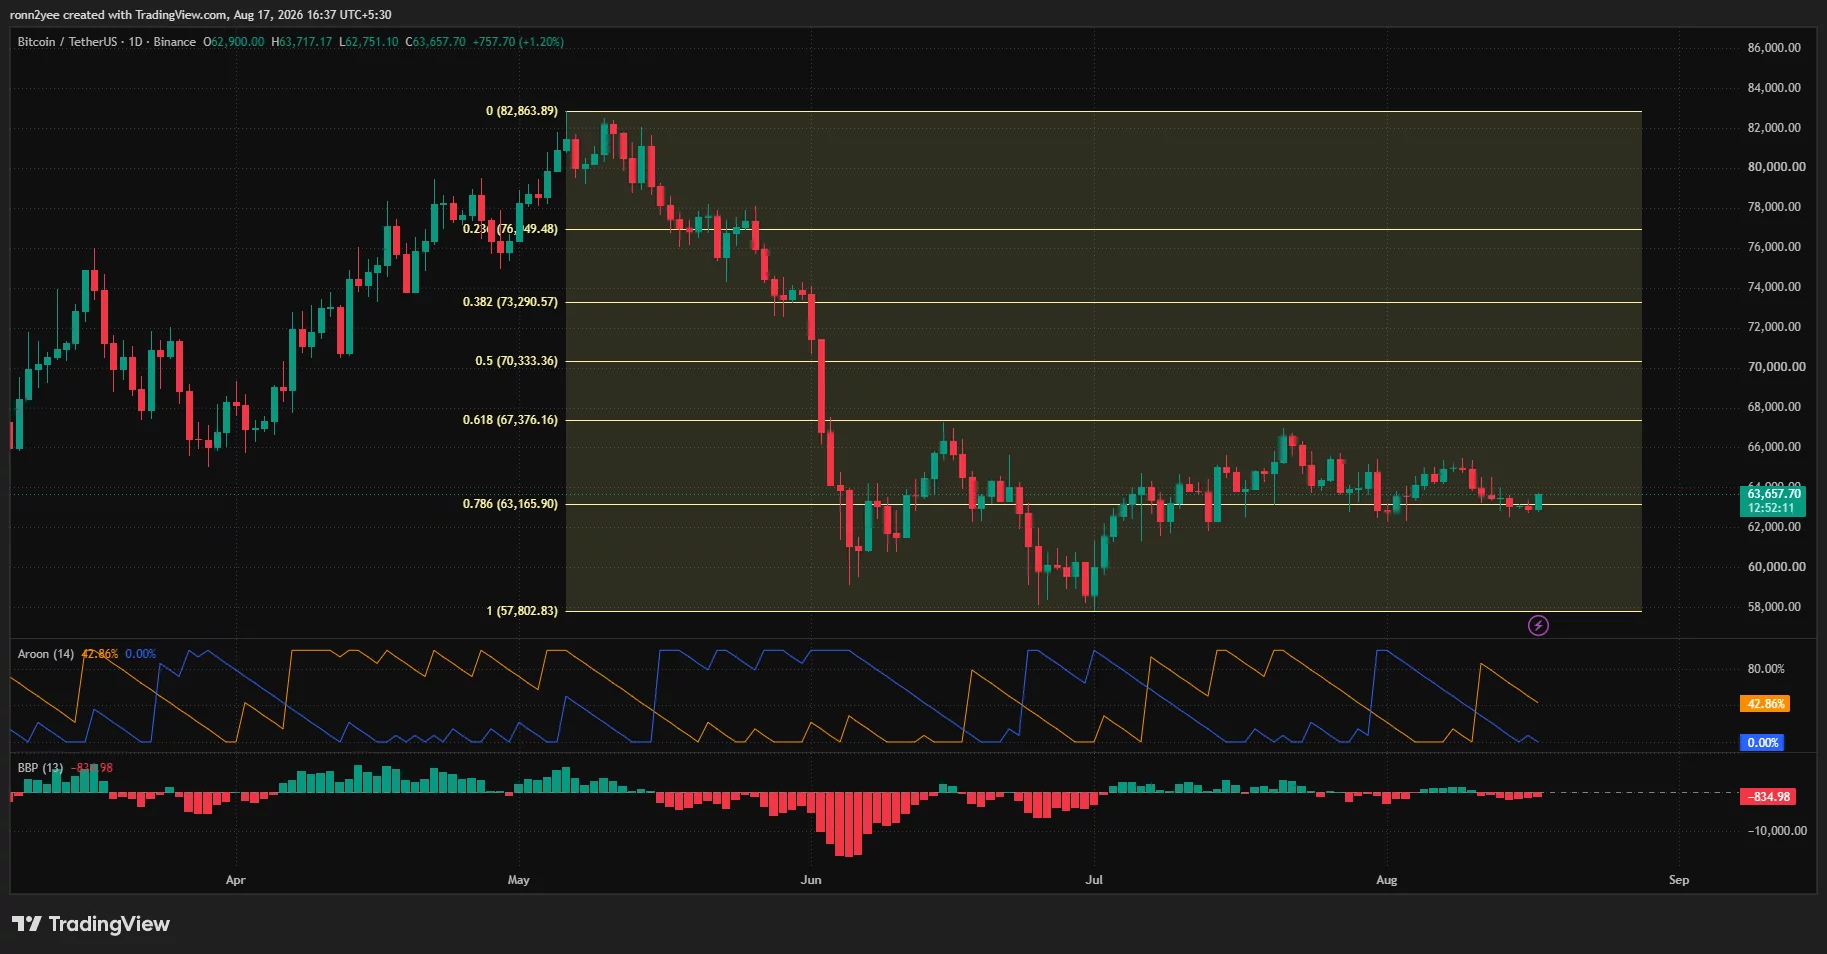
For the bullish case, Bitcoin must first close above $63,700 and $64,344. A break through the liquidation clusters near $64,800 would then allow buyers to challenge $65,500, followed by the June resistance around $67,376.
A daily close above $67,376 would mark a stronger change in market structure and open a possible move toward the 50% Fibonacci level at $70,333.
The bearish case begins with another rejection below $64,000. A drop through $63,166 would weaken the latest recovery, while losses below $62,200 and $61,900 could trigger liquidations toward $60,000.
Geopolitical and energy-market risks may add to that volatility. Notably, Brent crude rose above $89 as US-Iran negotiations remained stalled and shipping through the Strait of Hormuz slowed.
Only five commodity vessels crossed the strait on Saturday, compared with 31 during the previous weekend. Higher oil prices could renew inflation concerns and keep US interest rates elevated, limiting the amount of capital available for risk assets.
Bitcoin’s rebound has therefore protected the $62,500 floor, but the move remains a recovery inside a broader range. A break above $65,500 would strengthen the bullish case, while a loss of $61,900 would shift attention back to $59,000–$60,000.
Disclosure: This article does not represent investment advice. The content and materials featured on this page are for educational purposes only.