
LINK price defended the $23 support today, a key level it needs to sustain for a potential rally toward $45 in the coming weeks.
Summary
- LINK price has managed to hold support above $23 amid its downtrend over the past week.
- Chainlink has secured several key partnerships over the past month.
- Based on a double bottom pattern on the weekly chart $31 has emerged as a likely target.
According to data from crypto.news, Chainlink (LINK) price dropped 3.3% over the past 7 days. Trading at $23.37 at the time of writing, the token holds a market cap of over $15.8 billion.
Despite the recent drop, the token has remained 41% over the past month and 114% above its lowest point this year.
There are multiple catalysts that drove LINK price gains over the past month.
First, the United States Department of Commerce has recently partnered with Chainlink as one of the key oracle providers to bring U.S. government macroeconomic data on-chain.
The partnership with such a high-profile government body has increased visibility and credibility for the project, drawing greater interest from retail traders and potentially strengthening long-term adoption.
Chainlink has also strengthened its foothold in the real-world assets space. It has recently partnered with Ondo Finance on the launch of Ondo Global Markets, an initiative that brings over 100 tokenized U.S. stocks and ETFs on-chain.
The confluence of these developments could continue to drive further gains for LINK in the weeks ahead.
On the 1-week chart, LINK has managed to hold the $23 support level, which has acted as the neckline of a multi-year double-bottom pattern forming since March of last year.
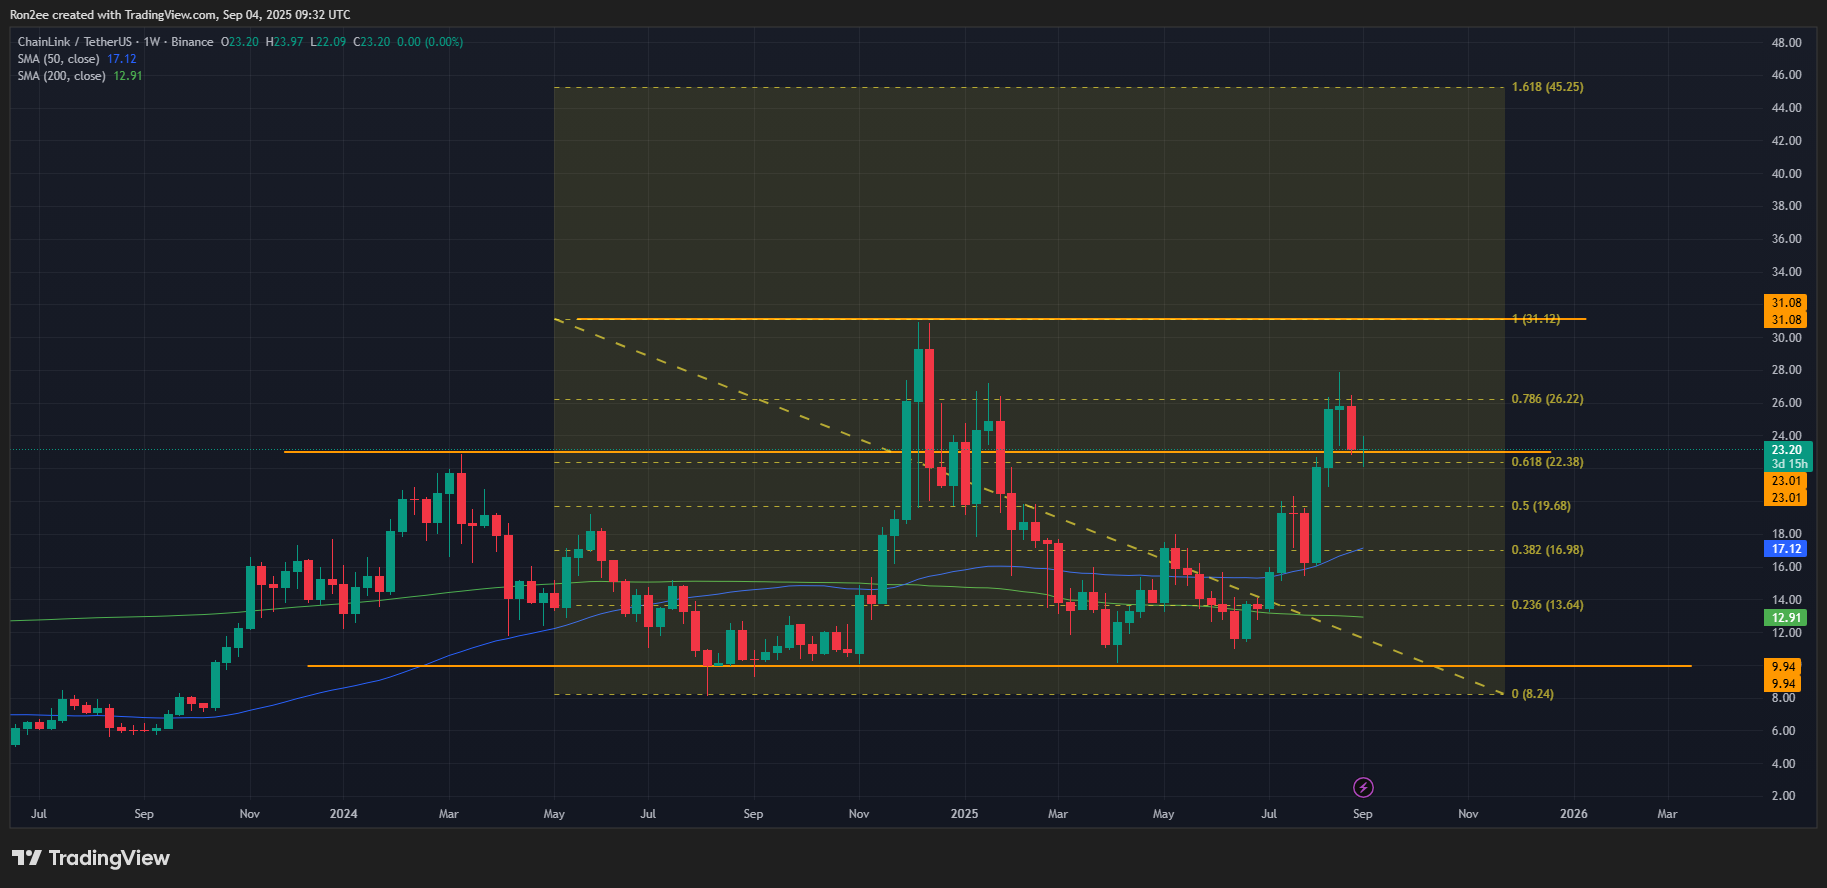
A double-bottom pattern is typically formed when the price drops to a similar low point on two separate occasions and rebounds, signaling strong support and the potential for a trend reversal.
As of press time, the 50-day simple moving average continues to trade above the 200-day, with a golden cross still in play, hinting at sustained bullish momentum.
If this momentum remains intact, LINK could likely target a move to $31, which represents a key resistance level and the upper neckline of the pattern. A decisive breakout above that point could trigger a rally toward $45, the projected target from the pattern, representing nearly 92% upside from the current price level.
As a bearish case, if LINK price falls below $20, it could invalidate the bullish setup and expose the token to deeper downside risk.
Disclosure: This article does not represent investment advice. The content and materials featured on this page are for educational purposes only.


