
Ethereum is opening May at around $2.3k, having spent the final week of April consolidating below the $2.4k resistance zone that has now rejected the price on multiple occasions. With the Coinbase Premium Index turning negative precisely as the asset stalled at resistance, the question entering the new month is whether US institutional demand has genuinely returned, or simply made a brief appearance before retreating again.
Ethereum Price Analysis: The Daily Chart
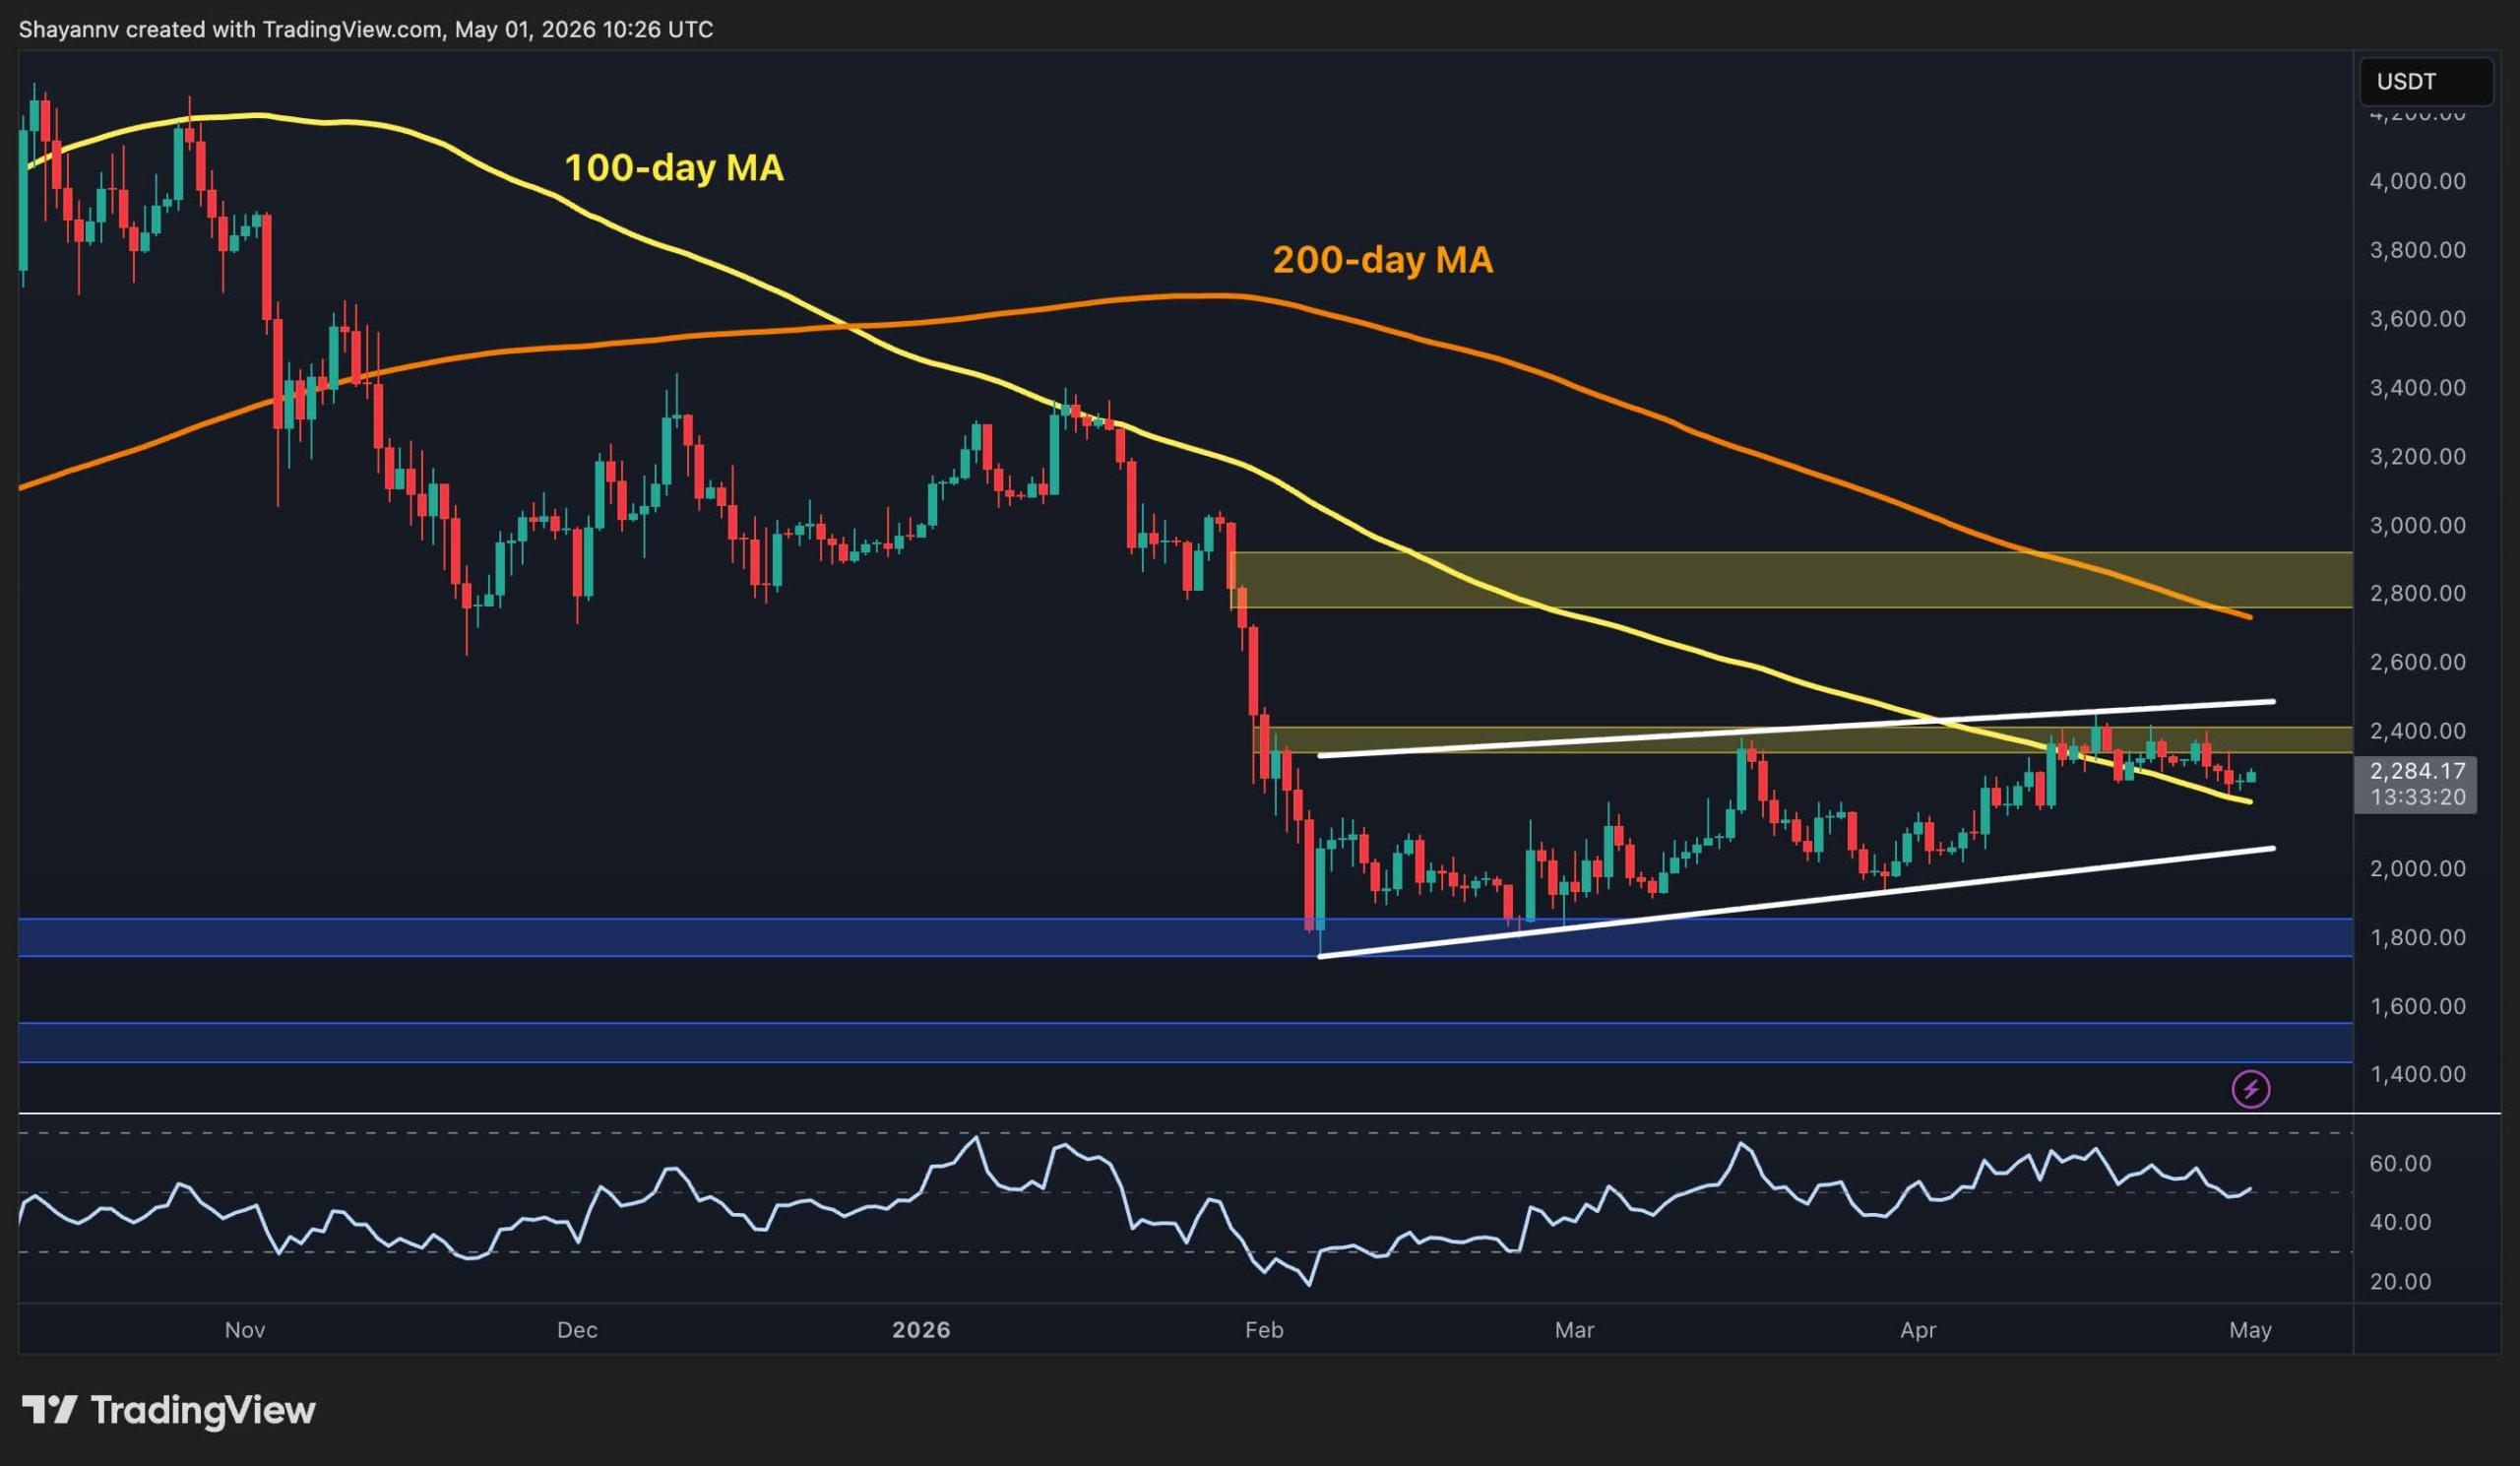
The ascending white channel from the February low remains the dominant structure on the daily chart, with its lower boundary tracking near $2k and continuing to provide the foundation for every pullback since March. The asset is currently sitting just above the 100-day moving average located at approximately $2.2k, which has now turned into a dynamic support.
The RSI has also faded from its mid-April peaks near to roughly 50, mirroring the pattern seen across the broader market as the April recovery momentum runs out of steam.
The structural picture has not broken down, but it has not progressed either. A daily close above the $2.4k supply zone remains the single requirement for the bullish thesis to regain credibility, opening the path toward the critical $2.8k area and the 200-day moving average nearby.
On the downside, the ascending channel’s lower boundary near $2k is the line that matters most, as a close below it would be the first structural damage since the February recovery began, and would bring the $1.8k demand zone back into active consideration.

ETH/USDT 4-Hour Chart
The falling wedge that formed after the mid-April peak near $2.4k is now in its final stages of compression, with the converging trendlines squeezing price into a decision zone right at current levels. ETH is sitting near the wedge’s lower boundary after a bounce from it, and the RSI on this timeframe has recovered modestly from its recent lows to 50, which indicates a reset in short-term momentum.
The horizontal support zone at $2.2k sits just below as the next meaningful floor if the wedge breaks to the downside. A clean 4-hour close above the wedge’s upper boundary and through $2.4k would signal that the pattern is resolving bullishly, with the grey arrow projection targeting approximately $2.7-$2.8k as the measured move.

Sentiment Analysis
After spending most of April in positive territory, which was a meaningful shift from the deeply negative readings that accompanied ETH’s collapse below $2k in February, the Coinbase Premium Index has abruptly flipped back to -0.03 as May opens.
The timing is not coincidental. The premium turned positive as price recovered from the lows and US buyers re-engaged, but it has now reversed precisely as ETH stalled at the $2.4k resistance zone again. US institutional demand appeared at the lows and faded at resistance, which suggests a market being accumulated cautiously, not one where conviction buyers are stepping in to force a breakout.
The broader context amplifies this reading. US investors are navigating a difficult macro environment entering May, with ongoing tariff policy uncertainty, the Federal Reserve maintaining a restrictive stance, and equity markets exhibiting the kind of intermittent volatility that historically drives institutional capital away from high-beta risk assets like ETH.
The current premium reading of -0.03 is far from the extreme negativity of February’s -0.20 lows, and a return to positive territory is entirely possible if the macro backdrop stabilizes, which could lead to a breakout above $2.4k and a more profound recovery in the coming weeks.

The post Ethereum Price Analysis: Is ETH Doomed in May as Key Metric Turns Negative? appeared first on CryptoPotato.


